

Open the Clients page
Sign in to the Management Tool, click Clients in the left navigation. The Clients tab is shown by default; the Client Groups tab is the peer view.What you see
The grid shows the full list of Clients you have permission to view:
The default columns:
When High Availability mode is enabled, an extra Node column appears showing which Application Server (as listed on the Cluster Settings tab) each Client is connected to behind the load balancer. The column is empty for offline Clients.
If at least one Client is experiencing any issue, an orange exclamation mark icon appears next to the Clients navigation link on the left of the Management Tool — a quick visual heads-up that something on the Clients page needs attention.
How the Client Groups column displays
Click any group name to open the Editing Client Group page for it.
If multiple network cards are installed on a Client computer, only the IPv4 and IPv6 addresses the Syteca Client is actually using appear in the IPv4 / IPv6 columns.
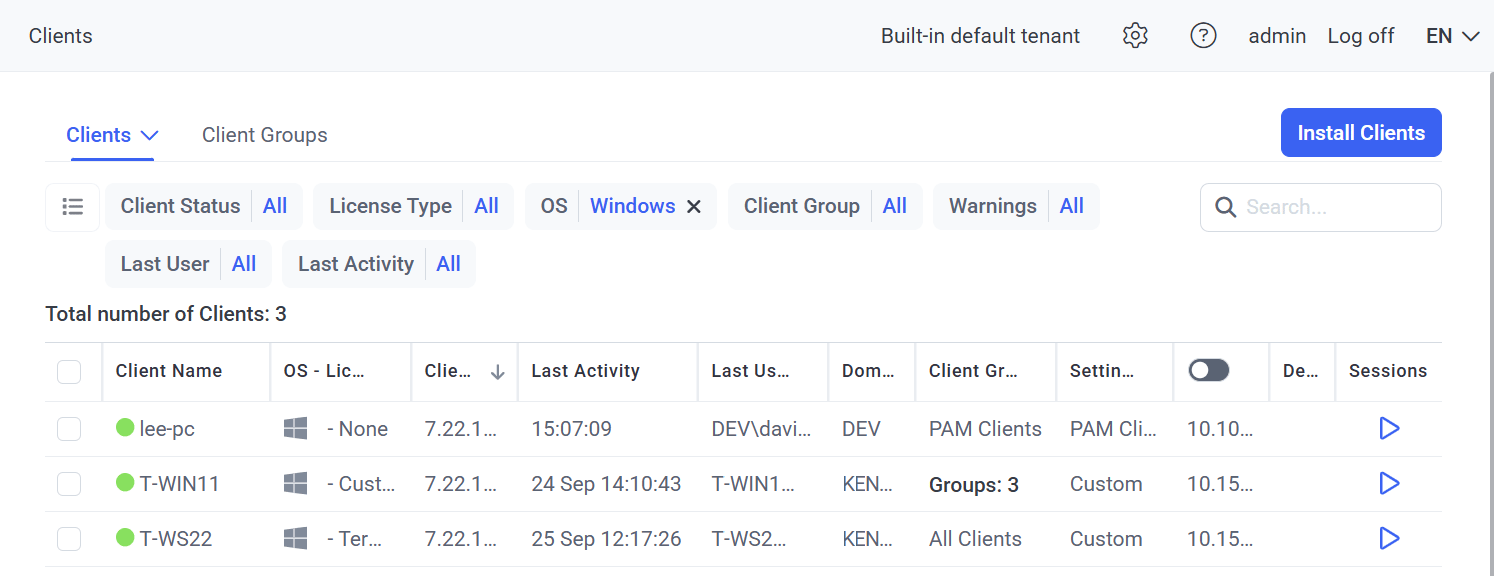
The Clients page — single inventory of every Client across all operating systems.
Filter, search, and sort
Actions
The Clients page is the launch surface for several operations:The number of options available depends on the permissions the user has — see Administrative permissions and Client permissions.
Related
Windows Clients
Install and configure Syteca Clients on Windows endpoints.
macOS Clients
Install and configure Syteca Clients on macOS endpoints.
Linux Clients
Install and configure Syteca Clients on Linux endpoints.
Client groups
Bulk-manage Clients with Client groups and inherited settings.