

Viewing the Activity Monitoring page requires the Viewing Monitoring Results administrative permission, plus the Viewing Monitoring Results Client permission for each specific Client whose sessions you need to see.
How sessions are organized
Monitored data from Windows, macOS, and Linux Clients is grouped into sessions. The data and lifecycle vary slightly by OS:
In every case, the maximum duration of one session is 24 hours. At 00:00 (midnight), all live sessions terminate, change from Live to Finished, and new live sessions start automatically. The two halves remain linked in the Session Player so you can navigate between them.
When are new sessions started?
By default, a session starts automatically as soon as any user logs in to a Client machine, and ends automatically when they log out. Sessions still active at midnight are also terminated automatically at that point. What happens next depends on the Client’s operating system:If an idle event was already registered before midnight and the user still hasn’t acted by midnight, that same idle event carries into the new session once it starts (Windows only - see the table above).
Automated system tasks (like a background script) don’t count as user actions and aren’t recorded. On Windows and macOS, an idle event still registers during a period with no user action, even if the system runs an automated task during that time.
Open the Sessions List
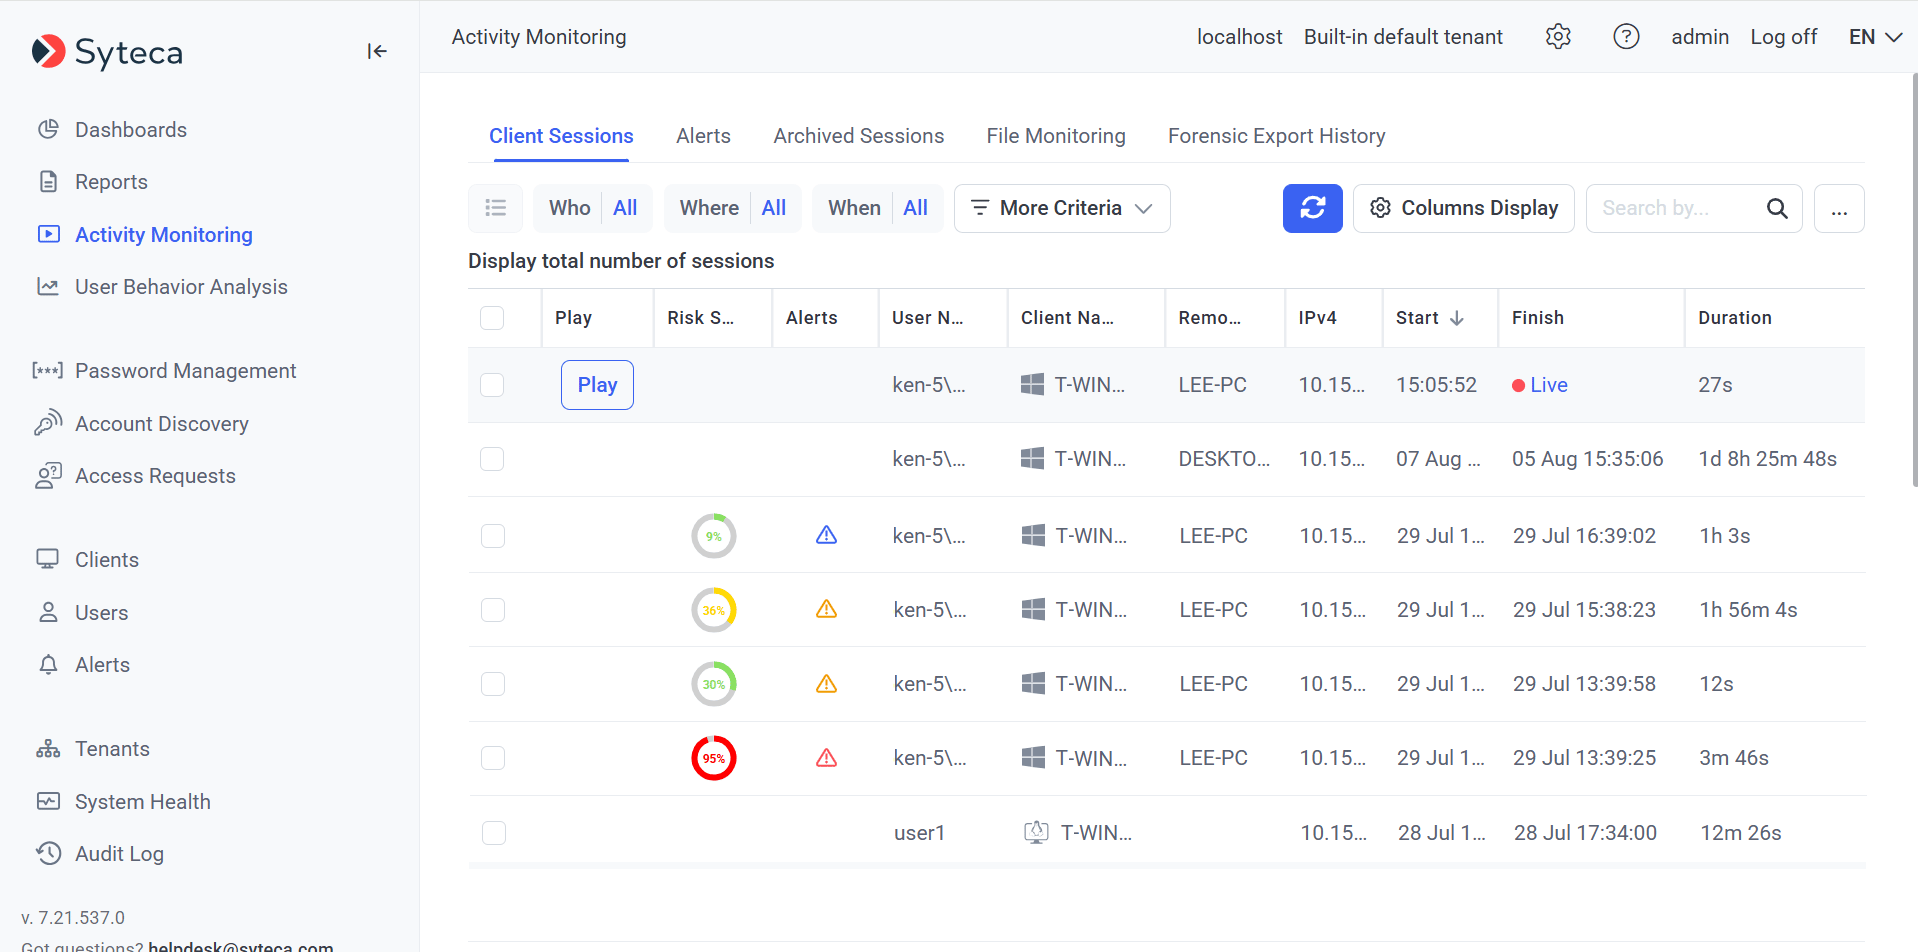
The Client Sessions tab - every recorded session in one grid, with OS icons, alert risk-level indicators, and Live vs Finished status.
Add or hide columns
Click Column Display at the top of the page to open the Manage Columns pop-up. Select checkboxes to add columns, deselect to hide, drag with the up/down arrows to reorder. Beyond the defaults, these columns are available:If the user logs into a Client computer remotely after the Client session already started using DameWare, Radmin, UltraVNC, or TightVNC, the remote IP address can’t be detected.
Filter sessions
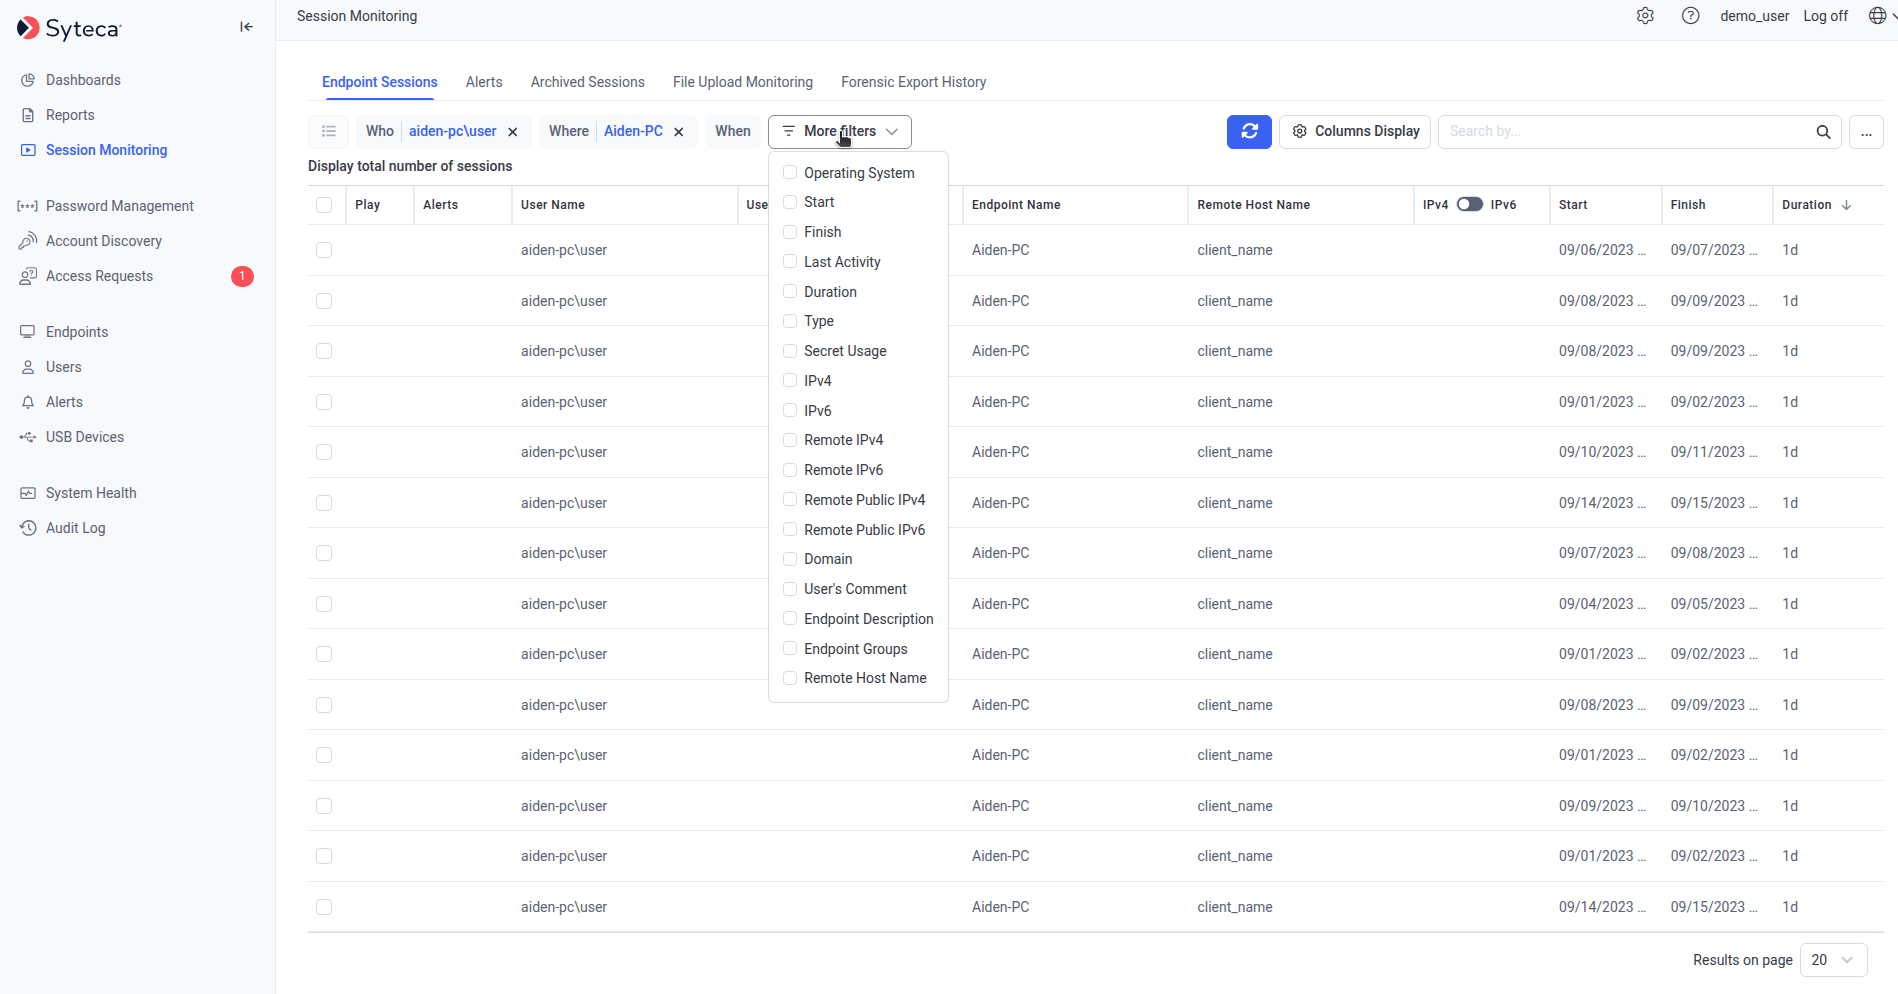
The session filters - default Who / Where / When always present, with More criteria revealing additional filter parameters.
Default filters
Additional filters
Click More criteria to add any of these:
To remove an additional filter, click the X next to its button. The default Who / Where / When filters always remain.
Search inside session content
The Search by box in the top right searches across multiple data types - not just session metadata, but the actual content recorded. The default search covers:- Application names
- Activity titles
- URLs
- Linux commands and parameters
- Alert names
- USB rule names
Search using a list of keywords
For investigations involving many search terms (a list of compromised account names, a list of regulated URLs, a list of forbidden commands), upload a keyword file:1
Create the keyword file
Create a
.txt file with one keyword per line (or separated by spaces).2
Upload it
Click the … button next to the Search by field, then Browse keywords, and select the file.
3
Run the search
Click the Search icon. Results appear in the session list.
Bulk Action
Select one or more sessions with their checkboxes (or use Select All in the column header), then click Bulk Action in the top left for these options:Only the Cleanup operation is available through Bulk Action - not the broader Archive & Cleanup operation, which is configured per-Client.
Related
The Session Viewer
Play back a session once you’ve found it - three panes, magnifier, live mode, bookmarking.
Alerts
The alert events that show as colored icons in the Alerts column.
UEBA risk scores
The behavior anomaly risk scores in the Risk Score column.
Pseudonymizer
How the list looks when Pseudonymizer is enabled - randomized aliases, hidden columns, Expose Requests.