

Open a session
The starting flow is the same on every OS: click the Play icon next to a session on the Client Sessions tab (Activity Monitoring page), or just double-click the row. The session opens in a new browser tab or window depending on your browser settings.Windows session playback
Windows sessions are the richest — they include screen captures or video, keystrokes, clipboard text, file upload operations, USB events, URLs visited, idle events, and secrets used. The Session Player shows the captures or video, the Metadata grid lists each recorded activity, and the Details area below the player shows fine-grained data for whichever record is currently selected.Clipboard text data
The Client monitors Copy, Cut, and Paste operations performed by context-menu commands or these shortcuts:Ctrl+C, Ctrl+Ins, Ctrl+X, Shift+Del. Clipboard activity appears in the Metadata grid’s Text Data column with operation-specific labels:
When a clipboard record is selected in the grid, the full clipboard text appears in the Details area below the Session Player. Any alerts triggered by clipboard content are displayed alongside.
USB device info
Whenever a USB device is plugged into a Client computer, the activity is recorded with these grid fields:
The USB device information appears in the Details area when you select the record in the grid. If a USB monitoring rule was triggered:
- The grid record gets a colored bar on the left (red / orange / blue per the risk level).
- The Session Player shows an Alert icon at the bottom (matching color).
If the Enable screen capture recording along with user activity recording option isn’t selected on the Client, sessions from that Client won’t contain any screen captures or video — but USB activity is still recorded in the grid.
URLs visited
When URL monitoring is enabled (Windows and macOS Clients), every URL the user visits in a browser is recorded.- The URL column in the Metadata grid always shows only the top and second-level domain (e.g.
example.com), even if the Monitor top and second-level domain names only option isn’t selected. - The full URL appears in the Details area when you select the record.
- If the user views one page for a while, multiple records may share the same URL.
Capturing a URL takes approximately 600 milliseconds, so the screen capture and the URL associated with it may not be perfectly synchronized — a capture may briefly appear next to the URL from the previous capture.
Idle state
Idle activity is recorded and displayed asIdle in the Metadata grid if either monitoring option is enabled on the Editing Client / Editing Client Group page → Monitoring [Windows/macOS] tab → Monitoring Parameters section:
- Detect system IDLE events
- Register IDLE event when user is inactive
Secrets used
PAM secrets used during a session are highlighted in color in the Metadata grid. When you select a secret-related record, the secret data associated with it appears in the Details area below the Session Player — useful for audit trails of “who accessed which credential, and when, and what did they do with it.”macOS session playback
macOS playback works the same way as Windows: open a session by clicking it on the Activity Monitoring page, view screen captures in the Session Player and associated metadata in the grid. The columns available are the same as Windows (see Metadata grid columns). The notable difference is the clipboard shortcut set.Clipboard text data (macOS)
The Client monitors Cut, Copy, and Paste operations triggered by any of these:
The labels are the same as Windows —
[Clipboard (Copy)]: for Cut or Copy operations, [Clipboard (Paste)]: for Paste. When a clipboard record is selected, the full text appears in both the Session Player area and the Details area below.
Linux session playback
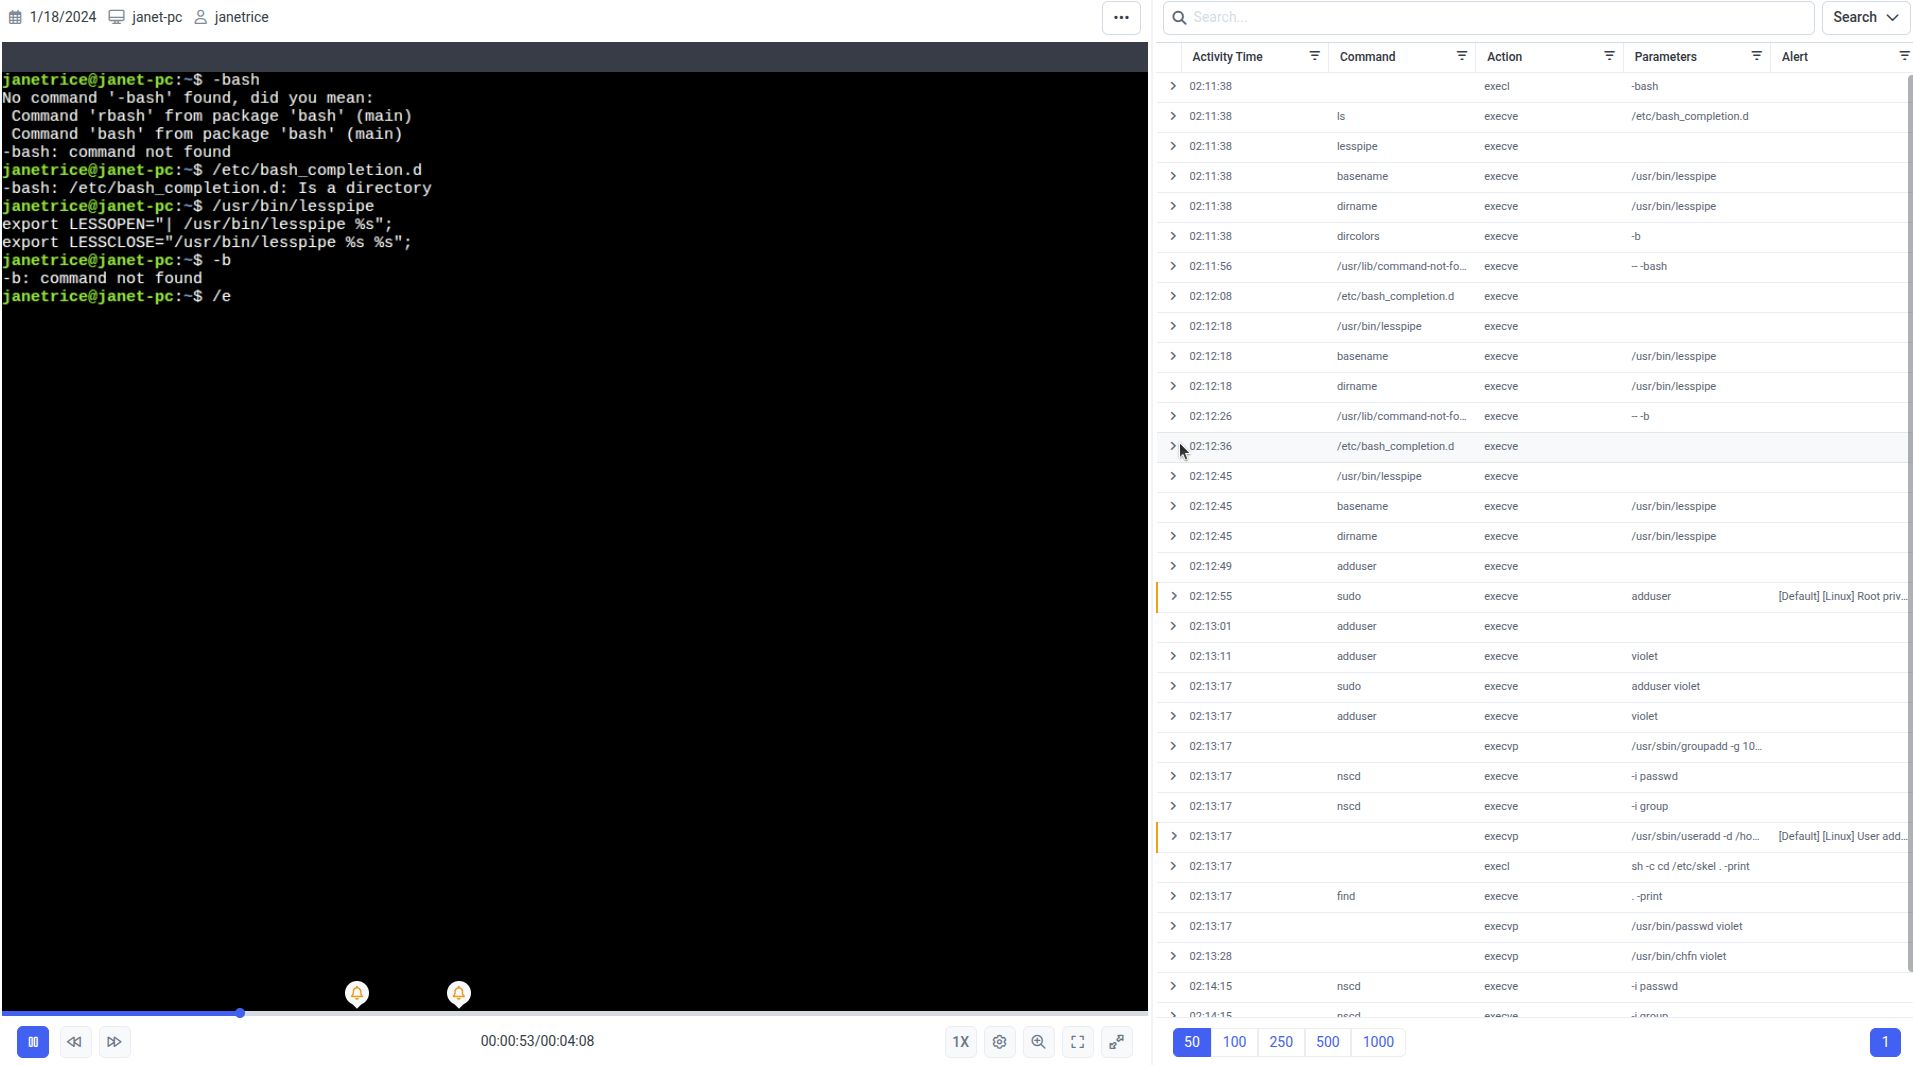
A Linux SSH session in the Session Viewer — the player graphically recreates the terminal exactly as the user saw it, with synchronized command metadata on the right.
Linux SSH and local terminal sessions
When you play an SSH or terminal session, the Session Player shows a graphically recreated terminal — what the user actually saw — and the Metadata grid shows the commands, function calls, parameters, and outputs.Search and filter Linux session data
Beyond the standard grid search, Linux sessions have additional filter options. Click the Search button next to the Search field to open the drop-down:Enable User Input Monitoring (Linux)
User Input Monitoring captures every keystroke a user types in an SSH or terminal session, not just executed commands. It’s disabled by default and requires a server-side configuration change to enable.1
Edit the server config file
On the Application Server computer, open the
EkranServer.Settings.config file in a text editor. The default location is:2
Add the EnableUserInputMonitoring key
Inside the configuration file, add:
3
Restart the Application Server
Restart the Application Server for the change to take effect.
4
Enable on the Client
Sign back in to the Management Tool. On the Editing Client (or Editing Client Group) page, on the Monitoring [Linux] tab, select Enable user input monitoring, then click Finish.
User Input Monitoring detects keystroke events as user actions separated by Enter key presses — the system groups all keystrokes between two Enter presses into one record.
Switch between linked SSH sessions
SSH sessions that restart automatically at midnight are linked to each other in the Session Player. Use the Previous Session and Next Session buttons in the player to switch between adjacent linked sessions.These buttons are different from the adjacent Previous and Next record buttons — see Navigate records with the keyboard for the record-level navigation.
Remote X-forwarded sessions
X-forwarding is used to monitor GUI applications (in X11 sessions) opened by users in remote Linux SSH sessions. These GUI applications can’t otherwise be monitored directly inside the SSH session — they need the X-forwarding pattern. Common use cases:- An application can’t be installed locally.
- A user wants to launch a Linux application on a macOS or Windows desktop.
- An application needs to be physically located on a remote server, but launched on a local workstation.
In the Sessions List
For X-forwarded sessions, the Sessions List on the Activity Monitoring page is slightly different:- A separate row appears in the grid for each application the user opens in the SSH session (the child) — in addition to the usual row for the SSH session itself (the parent).
- An X-forwarding icon marks the child rows.
- The User’s Comments column displays the name of the X-forwarded application opened.
- The OS filter has a Linux X forwarded option to display only X-forwarded sessions.
The User’s Comments and OS filter aren’t displayed by default. Add User’s Comments via the Columns Display button on the Sessions List, and add the OS filter via More criteria.
In the Session Viewer (child session)
When you play an X-forwarded child session:- The Session Player shows a To Parent Session button in the top right (in place of the usual Tools button) — click it to jump to the SSH parent session.
- The Metadata grid shows only Activity Time, Activity Title, and Application Name.
In the Session Viewer (parent session)
When you play the SSH parent session:- For each X-forwarded child session that ran inside this parent, the Metadata grid has:
xwindowin the Command column (indicating an X-forwarded child).- The application name in the Action column as a clickable blue link, alongside the user and host names. Click the link to jump to the corresponding X-forwarded child session.
Linux GUI (local X Window System) sessions
Local GUI sessions on Linux Clients are played like Windows or macOS sessions — screen captures in the Session Player, metadata in the grid. The grid columns for local X Window System sessions are:- Activity Time
- Activity Title
- Application Name (or command input by the user)
- Action (the user action or system function call executed)
- Parameters (input by the user)
Related
Session Viewer overview
The three-pane layout, playback controls, magnifier, live mode, and bookmarking.
Metadata grid
Column reference per OS, search/filter/sort, and Synced vs Filtered modes.
USB Device Monitoring
USB monitoring rules and the events that appear in the Metadata grid.
Use secrets
The PAM secrets that get highlighted in the grid when used during a session.