

Application Server logs
1
Open System Health
Open the System Health page and select the System State tab.
2
Download the logs
Choose Download Log Files (MT and Server) from the drop-down list.
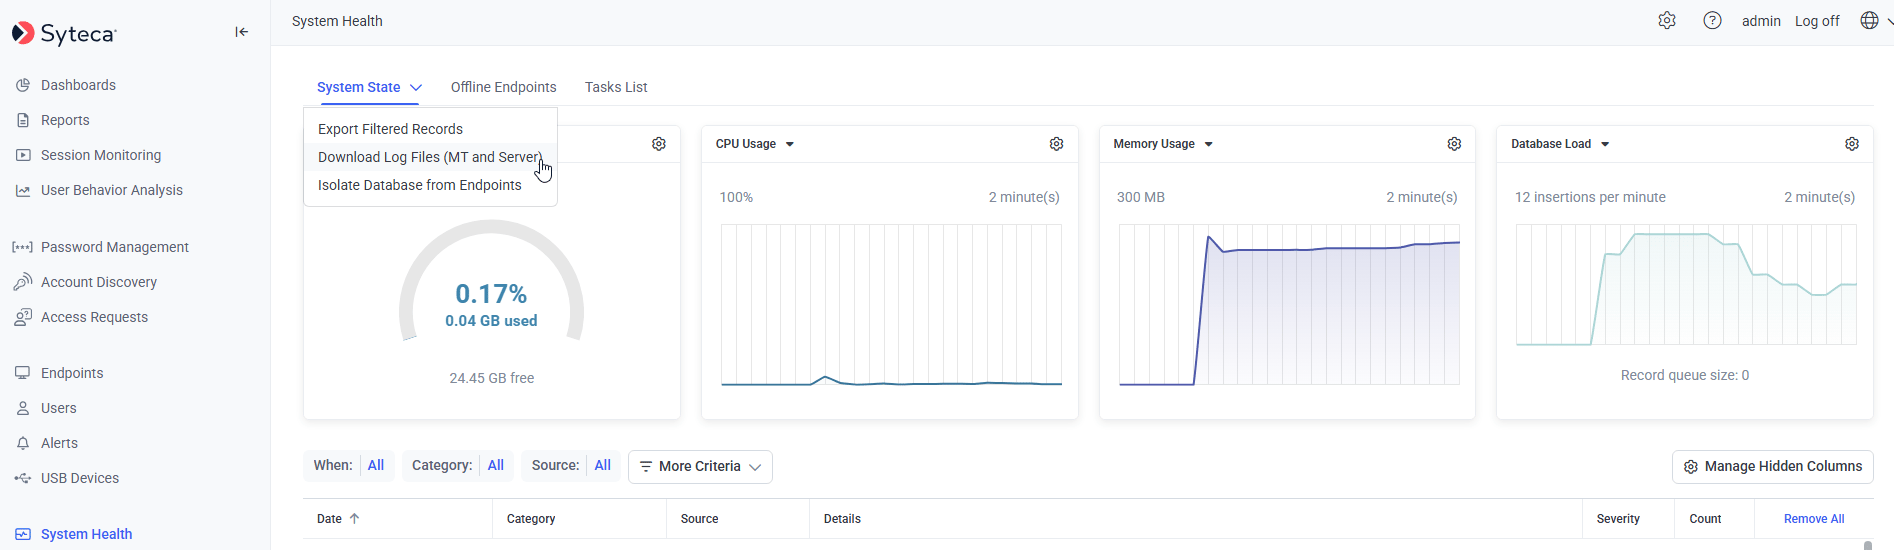
Downloading Application Server and Management Tool log files from the System Health page.
C:\Program Files\Ekran System\Ekran System\ServerLogs.
Application Server log levels
- Change level in the Management Tool
- Change level locally
1
Open Configuration
Click Configuration at the top of the Management Tool, then select the System Settings tab.
2
Set the Server Log Level
Scroll to the Server Log Settings section at the bottom, select the required level, and click Save.
Management Tool logs
Download Management Tool logs the same way as Application Server logs: open System Health → System State tab → Download Log Files (MT and Server). If the Management Tool isn’t accessible, find the log files directly on the computer where the Management Tool is installed, atC:\Users\SYTECAManagementTool\AppData\Local.
Client logs
1
Open the Clients page
Select the checkboxes next to the Clients whose logs you need.
2
Download the logs
Click Bulk Action, then select Download Logs.
Logs can only be downloaded through the Management Tool for Clients that are currently online. For offline Clients, collect logs locally on the Client computer using the steps below.
Collect logs locally, by OS
- Windows
- Linux
- macOS
Windows Client logs consist of two parts:
- Client logs, stored at
C:\Program Files\Ekran System\Ekran System\ClientLogs. - Syteca Connection Manager logs (when Connection Manager is used), stored at
C:\Users\<user>\AppData\Local\Syteca.
Client log levels
- Change level in the Management Tool
- Change level locally — Windows
- Change level locally — Linux
- Change level locally — macOS
On the Clients page, click the Client’s name, select the Properties tab on the Editing Client page, and scroll to the Diagnostics section at the bottom.
Syteca Connection Manager logs
Found atC:\Users\<user>\AppData\Local\Syteca.
Monitoring logs (Windows and macOS Clients)
Monitoring logs are text files written on the Client computer, separate from the Client diagnostic logs covered above.1
Open the Monitoring tab
On the Editing Client / Editing Client Group page, select the Monitoring [Windows/macOS] tab.
2
Enable monitoring logs
In the Log Files section, select Enable creating log files of monitored events.
3
Set a custom location (optional)
Enter a path in the log location field. Environment variables like
%appdata% and %temp% are supported.If the configured location isn’t accessible or is write-protected, logs save instead to
<systemdisk>\ProgramData\Ekran System\MonLogs. Changing the location later doesn’t move existing log files — they stay where they were, and new files start in the new location.Example configurations
Related
System Health dashboards
Where log downloads and system state live in the Management Tool.
Disconnected Clients
Diagnosing Clients that have gone offline.
Windows Clients
Windows Client installation and configuration.
Linux Clients
Linux Client installation and configuration.